Informing Cyclists on the Air Quality of Routes on the Montreal Island
...Visit Our Clean Ride Mapper for Montreal
...Visit Our Clean Ride Mapper for Toronto
User-friendly tools that can be used to limit cyclists' exposures to air pollution may have important public health benefits. As a case study, we developed a web-based route planning tool for Montreal, Canada, and evaluated whether this tool could lower air pollution exposures. This tool is based on spatial monitoring data for ambient nitrogen dioxide (a marker of traffic pollution; NO2) and provides users with the shortest route between an origin and a destination as well as a lower exposure alternative. With this tool, we estimated exposures to NO2 along shortest routes and lower exposure alternatives using origin-destination survey data collected in 2008. Low-exposure alternative routes were available for the majority of the 2,307 routes included in the analysis. On average, exposures decreased by 0.76 ppb (95% Confidence Interval: 0.72, 0.80) relative to the shortest route, with decreases of up to 6.1 ppb predicted for a single trip. The benefits of decreased exposure along alternative routes were often achieved with little increase (often less than 1 km) in the overall length of the route.
Data source
To be able to assess and compare the quality of the air for every possible route, we needed a data set with both wide coverage and high resolution. We are indebted to Mark Goldberg from the department of medicine at McGill University for giving us access to the dataset that resulted from the work described in A prediction-based approach to modelling temporal and spatial variability of traffic-related air pollution in Montreal, Canada which he co-authored with Dan L. Crouse and Nancy A. Ross.
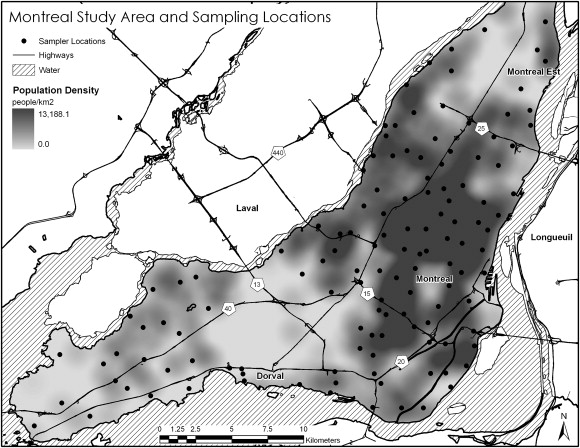
In this work, they produced an estimate of the yearly average of NO2 concentrations over the entire island of Montreal at a resolution of 5 meters by 5 meters. This was obtained by measuring NO2 concentrations at 133 locations in Montreal with passive diffusion samplers in three seasons during 2005 and 2006. A land use regression model, a proven statistical prediction method for describing spatial patterns of air pollution, was used to develop estimates of spatial variability across the city by regressing NO2 against available land-use variables.
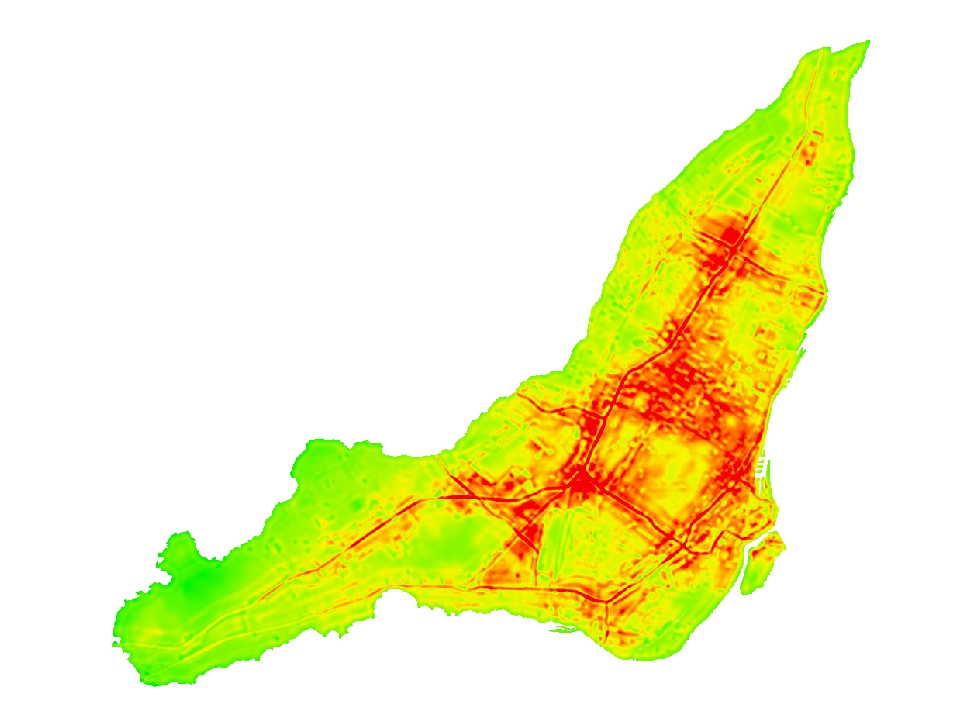
The result is a raster dataset over a regular grid of pixels with values ranging from 4.26 ppb to 37.34 ppb. The following images represent the location of the measured points and the raster data image resulting from the model prediction with red representing high concentrations and green low ones.
Data pre-processing
In order to be able to apply any routing algorithm, the road network needs to be decomposed into atomic elements which are the edges and the junctions of the network. An edge is a road segment that separates two consecutive intersections (and which therefore doesn't cross any other segment). When building a route, an edge is a building block since it is either taken from start to end or not at all. A pollution-related cost needs to be assigned to each edge representing the penalty of travelling through it. This was set to be the integral of the NO2 concentration along the edge which is mathematically the same as the length of the edge multiplied by its average concentration. Having a cost that is proportional to the length of an edge is natural since if two edges have the same concentrations of NO2 but one is twice as long as the other, we expect the cost of the long one to be twice the cost of the short one. To calculate this cost for an edge, we intersect it with the underlying pixels of our NO2 data set which breaks the edge into fragments of constant concentration. We then sum, over all the fragments generated, the product of the length of the fragment and its NO2 value which is constant.
At the end of this step, all the edges of our network have an associated NO2 cost representing the exposure to NO2 when taking that road segment.
Algorithms
Minimizing the length of the route and minimizing the NO2 exposure was done with the Network Analyst module of ArcMap. Network Analyst uses the Dijkstra algorithm to solve this problem. For the shortest path, the total length of the path is being minimized. The discovery of the lowest NO2 route is nothing more than a "shortest path" were the NO2 cost of segments is used as the cost (the impedance in Network Analyst's terminology) instead of the segment's length.
Application Architecture
The back-end of this application is an ArcGis server with the network analyst described above running as a web service. The front-end is a javascript page which queries our ArcGis server for the routes and Google for the underlying map.